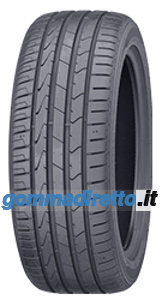
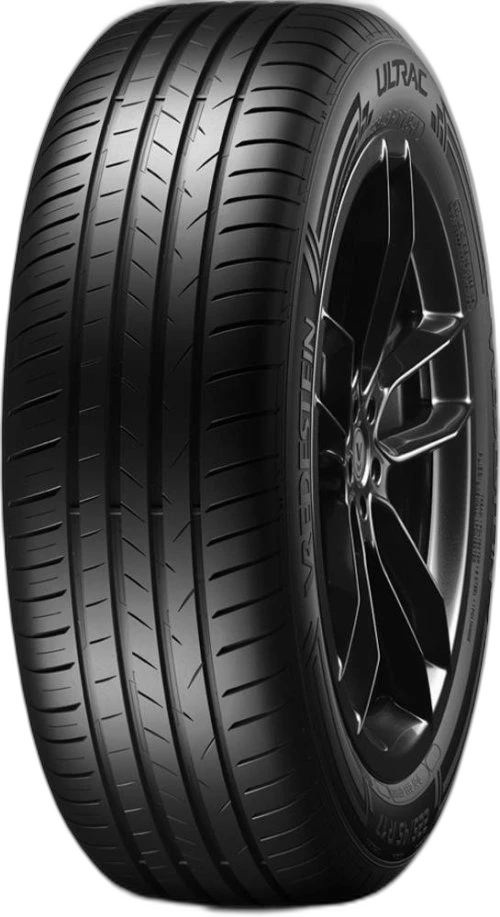
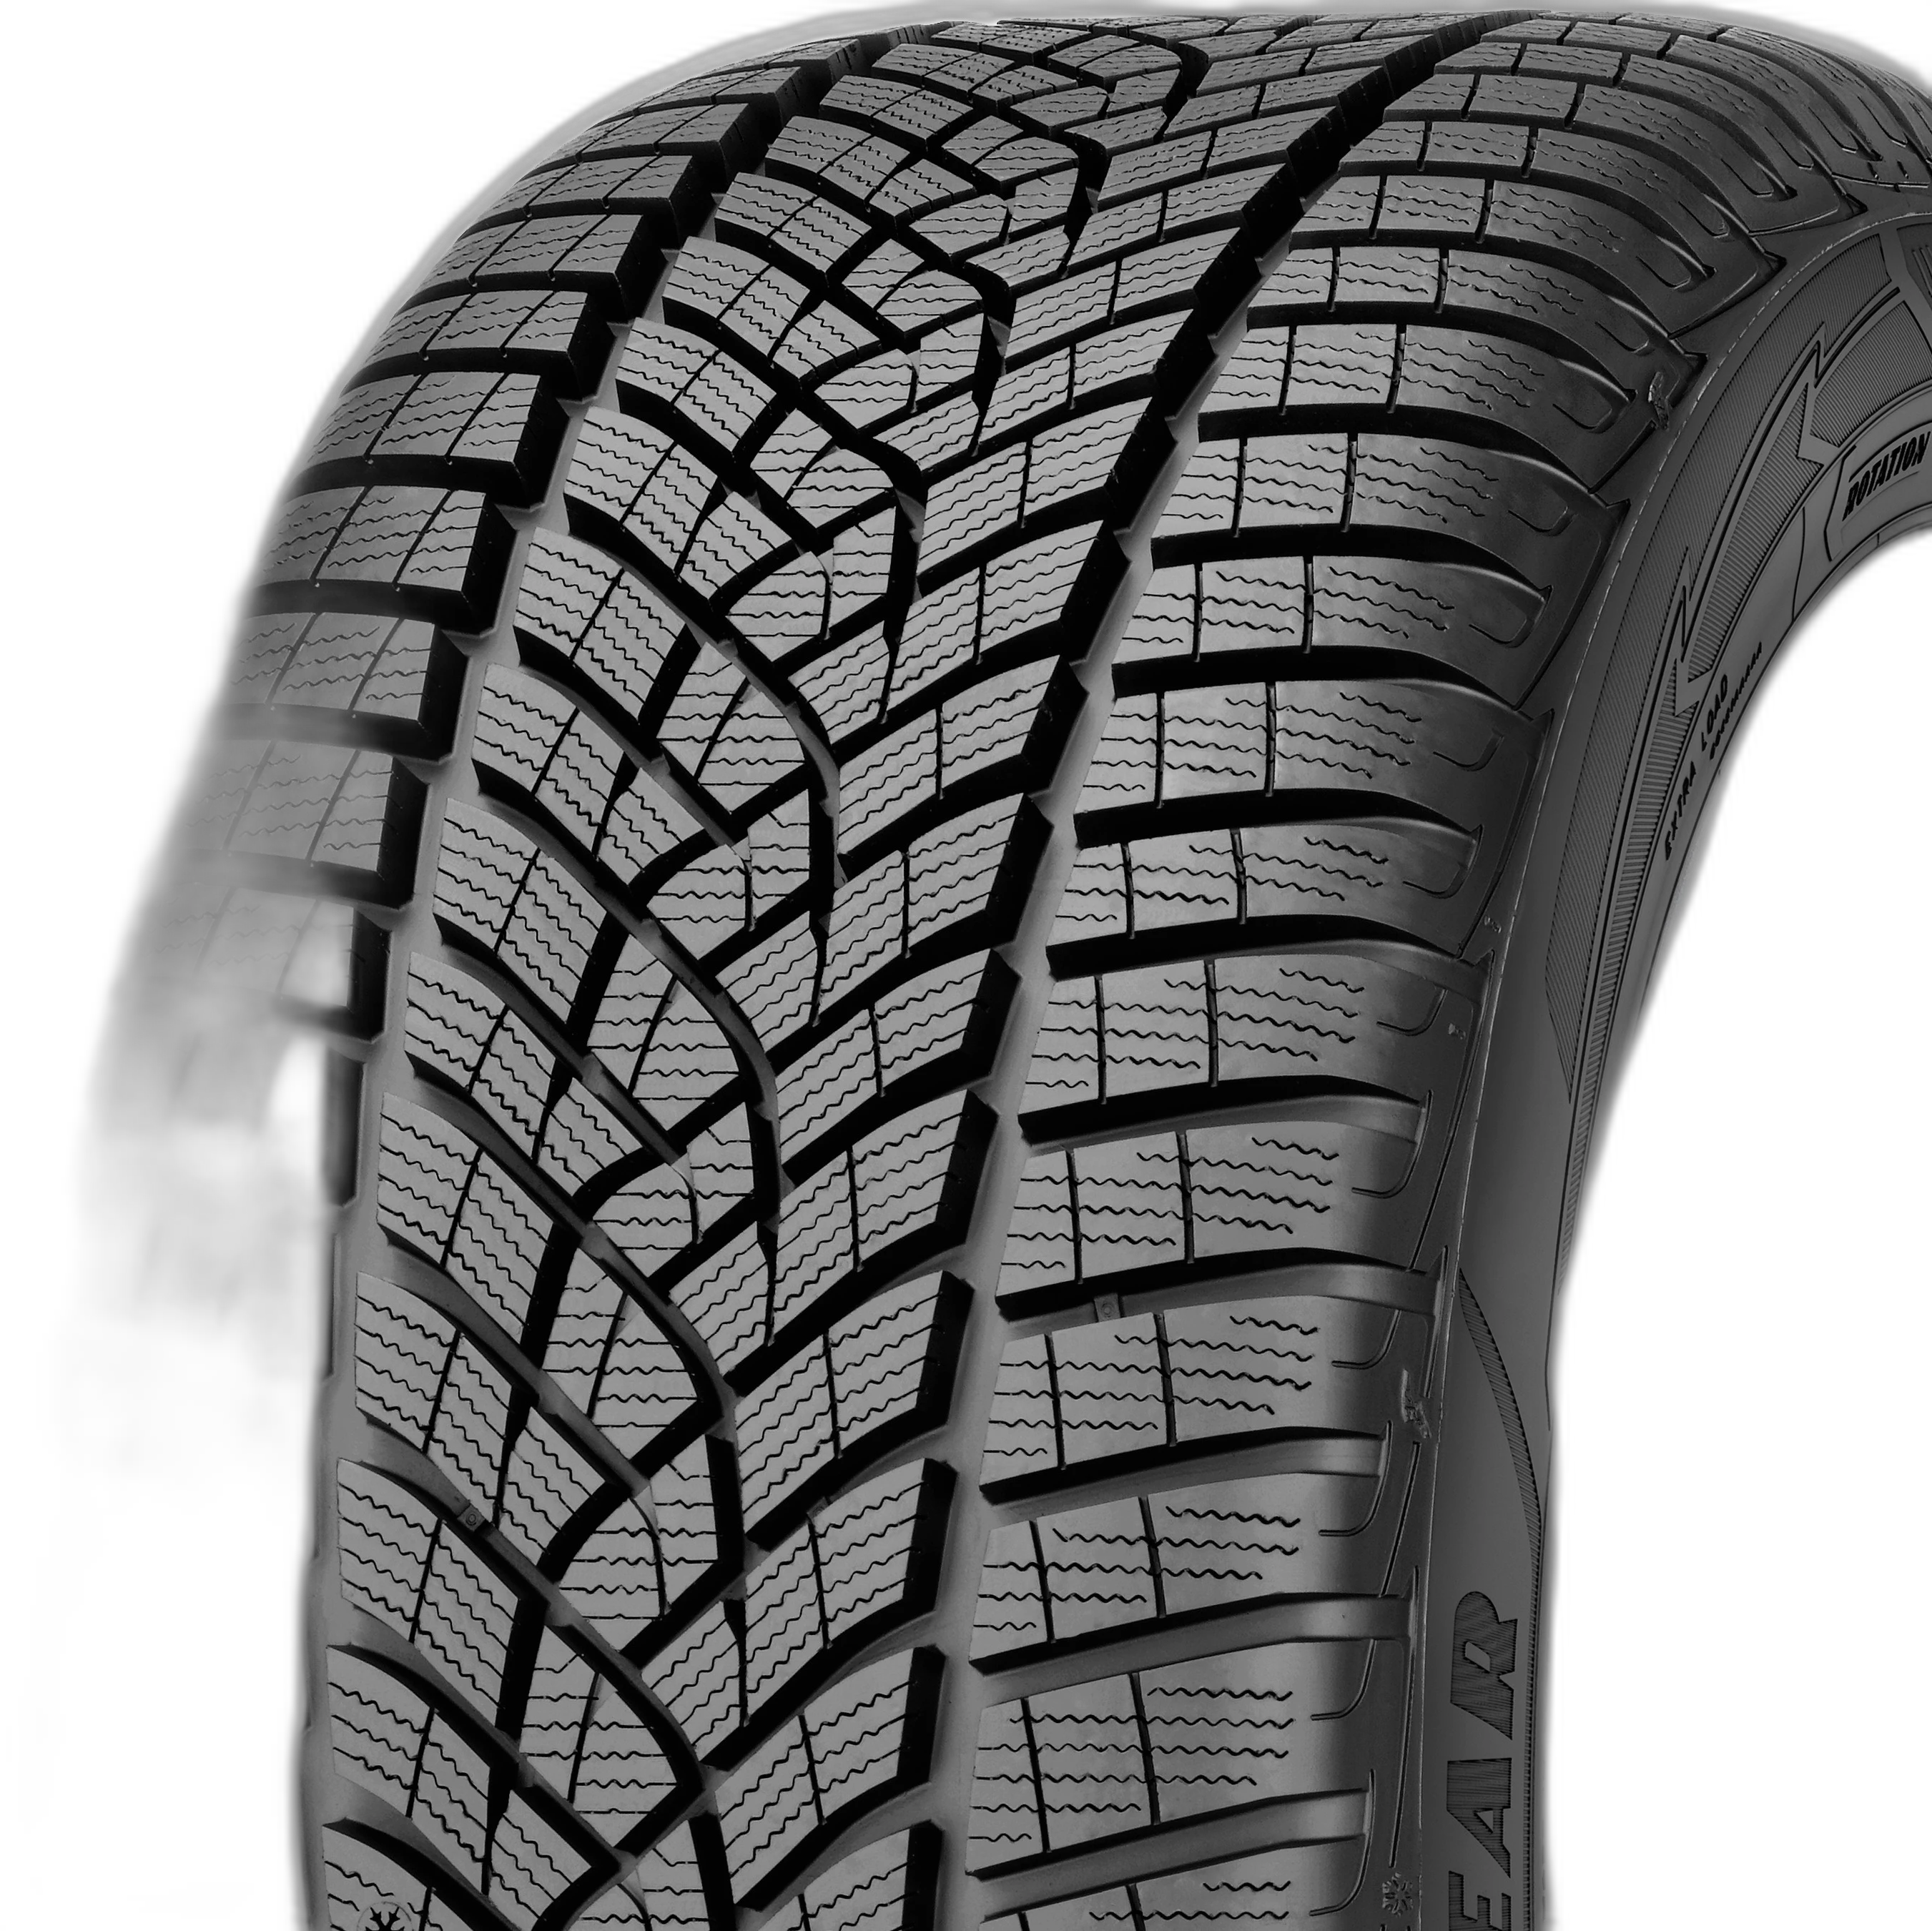
Vergleich: Apollo Aspire XP gegen Vredestein Ultrac+ gegen GoodYear Efficientgrip Performance 2 gegen GoodYear UltraGrip Performance+
Auch vergleichen mit


These tyres were not tested together in the same test. the scores below are aggregated from different independent tests, so direct comparison should be taken with caution.

 Apollo Aspire XPVredestein Ultrac+GoodYear Efficientgrip Performance 2GoodYear UltraGrip Performance+Apollo Aspire XPVredestein Ultrac+GoodYear Efficientgrip Performance 2GoodYear UltraGrip Performance+Apollo Aspire XPVredestein Ultrac+GoodYear Efficientgrip Performance 2GoodYear UltraGrip Performance+Apollo Aspire XPVredestein Ultrac+GoodYear Efficientgrip Performance 2GoodYear UltraGrip Performance+Apollo Aspire XPGoodYear Efficientgrip Performance 2GoodYear UltraGrip Performance+Apollo Aspire XPVredestein Ultrac+GoodYear Efficientgrip Performance 2GoodYear UltraGrip Performance+Apollo Aspire XPVredestein Ultrac+GoodYear Efficientgrip Performance 2GoodYear UltraGrip Performance+Apollo Aspire XPVredestein Ultrac+GoodYear Efficientgrip Performance 2GoodYear UltraGrip Performance+Apollo Aspire XPVredestein Ultrac+GoodYear Efficientgrip Performance 2GoodYear UltraGrip Performance+Apollo Aspire XPGoodYear Efficientgrip Performance 2GoodYear UltraGrip Performance+Apollo Aspire XPGoodYear Efficientgrip Performance 2GoodYear UltraGrip Performance+Apollo Aspire XPVredestein Ultrac+GoodYear Efficientgrip Performance 2GoodYear UltraGrip Performance+Apollo Aspire XPVredestein Ultrac+GoodYear Efficientgrip Performance 2GoodYear UltraGrip Performance+Apollo Aspire XPVredestein Ultrac+GoodYear Efficientgrip Performance 2GoodYear UltraGrip Performance+Apollo Aspire XPGoodYear UltraGrip Performance+Apollo Aspire XPVredestein Ultrac+GoodYear Efficientgrip Performance 2GoodYear UltraGrip Performance+Apollo Aspire XPVredestein Ultrac+GoodYear Efficientgrip Performance 2GoodYear UltraGrip Performance+Apollo Aspire XPGoodYear Efficientgrip Performance 2GoodYear UltraGrip Performance+
Preise in allen verfügbaren reifendimensionen dieser reifen vergleichen.
 VS
VS VSVSVS
 VSVS
VSVS VSVS
VSVS VSVS
VSVS Apollo Aspire XP vs Giti Gitisport S2
 Apollo Aspire XP vs Avon ZV7
 Apollo Aspire XP vs Viking Protech NewGenApollo Aspire XP vs Vredestein ULTRAC+Vredestein Ultrac+ vs Viking Protech NewGenVredestein Ultrac+ vs Avon ZV7Vredestein Ultrac+ vs Pirelli Cinturato (C3)Vredestein Ultrac+ vs Michelin Primacy 5
Reifenlab.at
Gratis — im App Store
Reifen vergleichen, Testergebnisse lesen und die besten Preise finden — alles in einer App.